Earlier this year I commenced a Masters in School Leadership at UWA. My very first assignment was all about examining Place; specifically how things like location, geography, history, traditions, economics, employment, race, social structure and class influence a principal’s role in the pursuit of enhanced outcomes for students. Clearly, the aforementioned factors mean that no two school leader roles are exactly the same. For instance, what is required for a beachside school in Perth’s western suburbs will not be congruous with the needs of a suburban school with a high EAL/D population, or another in the Pilbara or Kimberley.
With this in mind, I thought I’d share something that is a priority for my current school that may not even crack a mention at hundreds of schools around the country: Low student attendance.
A cursory glance at MySchool or any Education Department’s school directory will show you that the mean percentage of school attendance for primary students around Australia is in the low nineties. Focusing on primary WA Department of Education students, the 2015 mean was 92.6%, whilst for aboriginal students in our system it was 81%. Here are the numbers at Bayulu for 2013-2015:
2013: 70.3%
2014: 69.9%
2015: 74.4%
The takeaways? Firstly, in raw terms we’re a long way behind the state mean. The reasons behind this are complex and would need their own (much longer) post, but put simply life in remote aboriginal communities is very different to that of mainstream Australia. Secondly, we made some significant progress towards increasing student attendance in 2015 compared with the previous 2 years. This was a direct result of the new-for-2015 school leadership team moving attendance from the ‘too hard’ basket to the ‘if we put a strategy in place and work hard surely we’ll get results’ one.
So now we’ve been back at school for half of Term 1, how are we faring? Very well I’d suggest:
2016 (so far): 79.9%
We’re only 5 weeks in, but a stable staff and rigorous, established processes have seen the improvements of 2015 translate into a great start to 2016. If we look closer, we can see how this looks for the proportion of students in each of the four categories our Department uses to classify a students attendance:
- Green: regular attenders who attend school more than 90%
- Blue: students at indicated risk, attending school between 80 and 90%
- Orange: students at moderate risk, attending school between 60 and 80%
- Red: students at severe risk, attending school less than 60%

I love this graph for many reasons, but the main one is simple: Look at the colours! Semester 1 2016 has the biggest green section (37%) and the smallest red (13.9%) of any of the previous 7 semesters. Here’s what that looks like as a pie chart, compared to the dreadful outcomes that represented such a tragic outlook for our students from Semester 2, 2013:
So the proportion of kids above 80% (green and blue together) is more than double what it was three years ago! And the proportion of kids at severe education risk (the red) is 3 and a half times smaller than three years ago. You’d be forgiven for thinking that the two charts show data from different schools. We agree with our friends at the Stronger Smarter Institute: high expectation relationships work!
Now, with all this colour shift what is the bottom line for individual students? Here are the numbers for two students whose school attendance levels in 2013 and 2014 gave them almost zero hope of being literate and numerate upon leaving school. (The names used are fictitious):

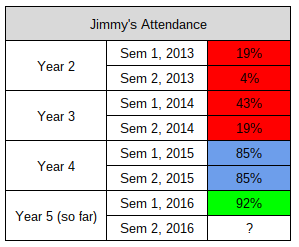
Just think about those numbers for a minute: Lainey has barely attended more than three days of school per week from the time she started compulsory schooling until now. Imagine the lack of continuity in her learning for those 3 years! And Jimmy once only came to school for 4% of an entire semester! Now, thanks to the outstanding work of their classroom teachers, our AIEOs and our leadership staff, the prospect of Lainey and Jimmy leaving school with some skills which will help them in life is much brighter. They’re now on the way to having a chance of breaking the cycle of poverty and disadvantage present in their families. And the sense of pride you see on their faces when they can sound out words or add up numbers by themselves is something that you just don’t see in city schools.
Is the progress sustainable? Can we maintain an attendance rate of 80% for the entire year? Will Lainey and Jimmy keep coming to school or will they fall off the wagon? These are questions that I can’t give you a guaranteed answer to. What I can guarantee, however, is that it won’t be through lack of engagement from our school leadership team and our staff that is the determining factor in what happens.
I’ll leave you with a few photos of the most important stakeholders in all this attendance talk; they serve as a great reminder as to why we do what we do!


